John Kersey continues his journey through robot safety, and the foundations of Artificial Intelligence systems changing our way of life at work and in the home. Here he looks at one of the essential basics – data.
“Data, data, data. I cannot make bricks without clay.” Sherlock Holmes – The Adventure of the Copper Beeches.
 A person may write a personal blog of 900 words, or be a regular Twitter poster, and by inputting these content channels into a cognitive analytics service, such as IBM’s Personality Insights, it can be analysed.
Certain aspects of that person can then be surmised:
- How accurate the analysis is from the input
- A summary of about 4 major points of that person
- 3 things they are likely to do and 3 they are unlikely to do
- 5 ratings each of their personality, consumer needs and values expressed as a %
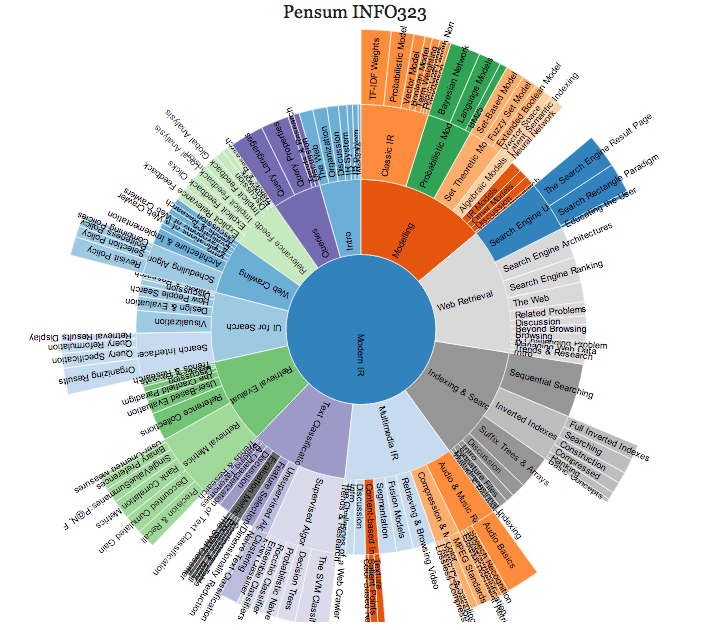
- An overall sunburst visualisation of that person at a glance.
This shows the new power of data, and how data can be creatively used. At one time in computing, data was just the by-product, and not considered especially valuable. But with the powerful analytical tools, we now view data as key to success, and a means to predict and shape the future. To get good results, you need good data.
The four Vs
 So what makes good data? Data is said to have 4 properties known as the 4Vs.
Volume. This is the size of the data. We are familiar with this from the files we transfer, devices we use to hold data, and sometimes the total capacity of IT systems.
It is well known the hard drive data system used for the Apollo moon mission was only 72 kilobytes, which is about the size of a low definition picture file! The volume of data will affect how well it is processed.
Variety. Data comes in various forms beyond letters and words and can be sounds, pictures, social media feeds, web pages with more and more being developed. Our system must be able to process the data in this variety of forms to gain valuable insights.
Veracity. Data can be corrupted or may be unreliable or inaccurate for a number of reasons. This is why automatic means such as sensors are preferred to human means which may introduce human error or bias.
Velocity. This is the rate or frequency that data is presented. For some applications it may seem like a continuous flow of data in real time. In other instances, data may be sent at fixed intervals say hourly. The use the data is put to will determine if this is acceptable, a fire signal sent at hourly intervals would not have much benefit in terms of life safety as an example.
Adding value
 Many commentators add their own extra Vs but a common addition is Value. Data ultimately needs to be processed and analysed to gain insight and drive purpose. Data for the sake of data doesn’t provide any benefit. Where we might see obvious causes or direct links we can decide what data we need to gather and either find or make the required data sets or databases.
However real life is not always so straightforward and we sometimes see hidden factors at play that influence performance or behaviour. So we either need to anticipate these or retrospectively access the data. Fans of the Freakonomics style books will be familiar with the syndrome – there isn’t always an obvious force or regulator affecting the situation or a powerful underlying influence has been missed.
For example, a study showed cyclists were 12 times more likely than car drivers to experience a fatal accident. However if more bikers travel together in a pack then they are safer. Similarly, a reduction in the speed limit from 30 mph to 20 mph resulted in an increase in road accidents which was not presumably the intention of the traffic planners.
Inaccurate data
 Previously we could live with approximations or extemporise data to gain some borderline results. As we make use of powerful machine learning tools we will face issues where there is a lack of precision.
More brutally, inaccurate data will lead to wrong results and will compound errors – garbage in, garbage out and thus garbage learned.
The flawed data becomes the new normal and this leads to inaccuracy and skewed results. In this way the system can lose credibility. So it is a good investment to find and map data sources and make sure they are robust as a preliminary to building a fir for purpose AI based safety system. Ultimately the power and utility of your system will be based on this investment in management of the data.
John Kersey is the health and safety manager – people and culture at ISS UK
Disclaimer. The views expressed in this article are those of the author and do not necessarily represent those of any commercial, academic or professional institution I am associated with.
The Safety Conversation Podcast: Listen now!
The Safety Conversation with SHP (previously the Safety and Health Podcast) aims to bring you the latest news, insights and legislation updates in the form of interviews, discussions and panel debates from leading figures within the profession.
Find us on Apple Podcasts, Spotify and Google Podcasts, subscribe and join the conversation today!


