
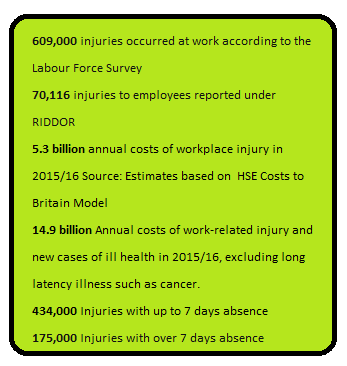
Earlier this month the Health and Safety Executive (HSE) published its annual injury and ill health statistics for 2016/17, which show 1.3 million workers suffering from work related ill-health, 609,000 workplace injuries and 137 fatalities.
The figures show that while Britain remains one of the safest places to work, there is still a long way to go to improving figures, especially those around work related ill-health.
These latest figures should act as a spur to reduce the impact of ill-health and injury on Britain’s workforce and businesses and we cannot rest on our reputation. – Martin Temple, HSE chair
The annual statistics, compiled by HSE from the Labour Force Survey (LFS) and other sources, cover work-related ill health, workplace injuries, working days lost, costs to Britain and enforcement action taken.
Here, SHP, takes a deeper look into the figures – looking at the true prevalence of stress in our workplaces, the numbers of people injured and made ill at work, and the fines and sentences – breaking down the numbers down across industries.
Injuries
Acts of violence now account for 7% of Non-fatal injuries to employees.
The rate of self-reported non-fatal injury to workers showed a downward trend up to 2010/11; since then the rate has been broadly flat. The rate of non-fatal injury to employees reported by employers also shows a long-term downward trend, which has continued in more recent years. Reporting is known to be incomplete and may be distorting the trend.
The most common injuries were slips, trips and falls on the same level, followed by lifting / handling, and being struck by an object. Acts of violence now account for 7% of Non-fatal injuries to employees.
READ: Five common workplace injuries
Fatalities
There has been a long term downward trend in the rate of fatal injury, with indications of levelling off in recent years.
In 2014/15 there were 142 workers killed at work and in 2015/16 this number rose slightly to 144 – so this year’s figure shows a slight downward trend.
While we are encouraged by this improvement on the previous year, we continue unwaveringly on our mission to prevent injury, death and ill health by protecting people and reducing risks – Martin Temple, Health and Safety Executive
Across all industries, fatal injuries to workers have halved over the past 20 years.
The 137 workers fatally injured between April 2016 and March 2017 is equivalent to 0.43 fatalities per 100,000 workers – the second lowest on record.
Ill health
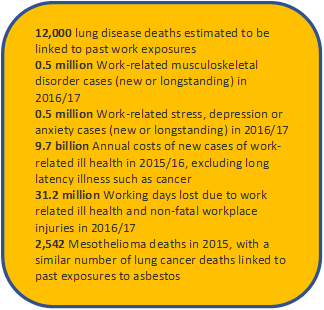
Workplace injury and new cases of ill health cost Britain £14.9bn a year with 31.2 million working days lost.
The prevalence rate of work-related stress and mental health problems among workers in Great Britain rose in 2016-17 to 1,610 per 100,000 workers, which is the highest rate for at least the past 11 years.
This means that the more common mental health conditions have now overtaken musculoskeletal disorders (MSDs) as the most commonly reported work-related illness. The rate of self-reported work-related MSDs has shown a generally downward trend, the HSE said.
Human health, social work, defence and education are among the top jobs with higher than average rates of stress, depression and anxiety.
The HSE says that workload is the top cause of work related stress, depression and anxiety.
A recent report published by the Department for Work and Pensions and Department of Health, has stressed that ‘the UK faces a significant mental health challenge at work.’ The review includes a detailed analysis that explores the significant cost of poor mental health to UK businesses and the economy as a whole.
At a time when there is a national focus on productivity the inescapable conclusion is that it is massively in the interest of both employers and Government to prioritise and invest far more in improving mental health – DWP
Prosecutions and sentencing
554 cases were prosecuted with fines from convictions totalling £69.9 million. The average penalty was around £126,000 per case — more than double the average fine in 2015/16.
“This is the first full year where new sentencing guidelines have been in effect. Under these guidelines the fine is related to the turnover of organisations and, as a result, large organisations convicted of offences are receiving larger fines than seen prior to these guidelines” the HSE said.
The report shows a rise in health and safety fines, of around 80%, from £38.8 million in 2015/16 to £69.9 million
We will only achieve long-term improvement by a collective approach to improve workplace standards. Poor standards lead to poor health and increased injuries, which is bad for the workforce and business. – Martin Temple, HSE Chair
Industries
Education
The latest figures show that in the teaching profession there were 2,460 cases of work-related stress per 100,000 workers. This was twice the average rate across all industries of 1,230 cases per 100,000 workers in the three-year period averaged over 2014-15 to 2016-17.
A recent DfE report on teachers’ decisions to leave teaching found workload was the single most common reason – cited by 75 per cent of ex-teachers as the reason they quit the profession. Changes in policy were the second biggest cause.
Teachers are now having to deal with more and more pressures of children suffering from mental health issues. Teachers, parents and children are facing a “mental health crisis” in schools, according to charity YoungMinds. With increased pressures of exams, social media, problems at home, and bullying.
A Department for Education spokesperson said: “teachers play a hugely important role in our society, and there are now more teachers in our schools than ever before.
“We are actively addressing the issues that teachers cite as reasons for leaving the profession, for example by supporting schools to reduce unnecessary workload.”
Construction
Agriculture, forestry and fishing had the highest rate of injury per 100,000 workers, followed by construction.
In construction there were 80,000 workers suffering from work-related ill health each year, 30 fatal injuries to workers, and 64,000 non-fatal injuries to workers. Falls from height equated to almost half the construction deaths in the last five years.
Agriculture
Construction had the most deaths by sector with 30, but because fewer people work in agriculture than in construction, farming has a higher fatality rate Farmers Weekly reports, adding: “Again agriculture fares badly, accounting for 44% of all fatal injuries to self-employed workers, compared with 29% for construction.”
The fatal injury rate for agriculture is 18 times higher than the five-year average for all industries.
Farming has 8.61 fatalities per 100,000 workers compared with just 1.82 fatalities per 100,000 for construction.
According to Martin Malone from the Farm Safety Partnership: “Machinery and transport continue to be the main causes of life changing and life ending injuries on farms.
“In fact 40 per cent of all farm workers who have lost their lives in agriculture over the past decade were workplace machinery-transport related.
“Whilst this year we have seen an improvement in the numbers of farmers losing their lives as a result of machinery and transport, the fact is that one death is one too many.”
Waste
The Environmental Services Association (ESA) says the new figures show “little sign of improvement”.
Stephen Freeland, ESA’s H&S Policy Advisor said: “For too long now, the waste management industry has continued to lag behind other sectors and with little indication that the overall safety record for the industry as a whole is showing any sign of meaningful improvement.
“For ESA these statistics are rather disappointing and don’t seem to reflect progress we’ve been making in recent years.
“In fact, our forward thinking approach to health and safety has seen ESA Members reduce injuries by 37% over the two years since 2014.“It is nonetheless clear that the industry as a whole has much to do to reverse the trend identified in HSE’s statistics, and for its part ESA will continue to ensure best practice and ‘lessons learnt’ are disseminated more widely across the industry for the benefit all.”